Open Access
Fig. 4
Download original image
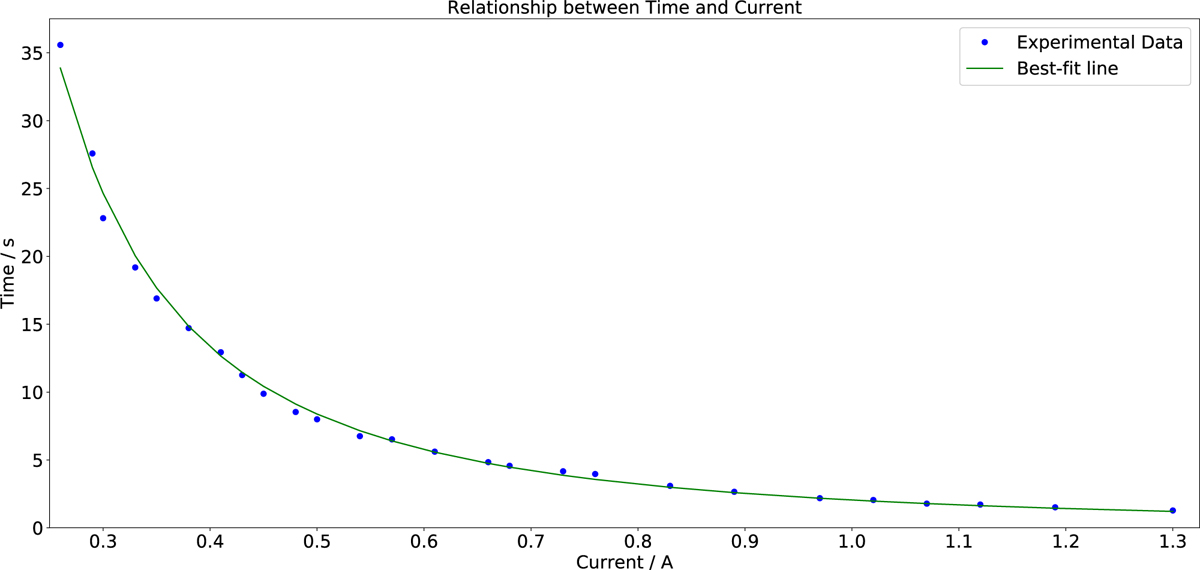
Relationship between the current I and time taken to unwind t. The blue dots represent the experimental data values, whereas the green curve represents the best-fit curve with ΔT = 18.23 °C.
Current usage metrics show cumulative count of Article Views (full-text article views including HTML views, PDF and ePub downloads, according to the available data) and Abstracts Views on Vision4Press platform.
Data correspond to usage on the plateform after 2015. The current usage metrics is available 48-96 hours after online publication and is updated daily on week days.
Initial download of the metrics may take a while.