


| Issue |
Emergent Scientist
Volume 10, 2026
|
|
|---|---|---|
| Article Number | 1 | |
| Number of page(s) | 8 | |
| Section | Chemistry | |
| DOI | https://doi.org/10.1051/emsci/2026001 | |
| Published online | 08 June 2026 | |
Research Article
Why matrices matter: investigating dye quantification in listerine® with UV-Visible spectroscopy
1
Département de Chimie, École Normale Supérieure Paris-Saclay, France
2
Faculté des sciences d’Orsay, Université Paris-Saclay, France
* e-mail: This email address is being protected from spambots. You need JavaScript enabled to view it.
Received:
3
July
2025
Accepted:
28
February
2026
Abstract
While numerous studies have explored the quantification of compounds using UV-Visible absorption spectroscopy, matrix effects are rarely studied. This work, investigates the influence of matrix effects on the spectrophotometric determination of two dyes (Quinoline Yellow and Fast Green FCF) in Listerine®. The concentrations of the dyes are determined using both external calibration and standard addition, with only the latter method compensating for matrix effects. Indeed, significant matrix effects are found in both cases, with a notably stronger influence observed in the quantification of quinoline yellow.
Key words: Matrice effects / external calibration / standard addition / UV-Visible / dye assay / spectroscopy
© C. Taralle et al., Published by EDP Sciences, 2026
 This is an Open Access article distributed under the terms of the Creative Commons Attribution License (https://creativecommons.org/licenses/by/4.0), which permits unrestricted use, distribution, and reproduction in any medium, provided the original work is properly cited.
1 Introduction
Dyes are widely used in consumer products, from food and cosmetics to pharmaceuticals and hygiene products, to improve visual appeal and help distinguish between different formulations [1,2]. Despite their ubiquity, synthetic dyes are subject to strict regulatory oversight [3–5] due to potential health concerns, including allergic reactions and long-term toxicity at high concentrations [6,7]. Accurate quantification of these dyes is therefore essential to ensure both consumer safety and regulatory compliance.
Among the many analytical challenges associated with dye quantification, matrix effects are particularly problematic. These effects occur when other components in the sample interfere with the measurement of the analyte, leading to biased or inaccurate results [8]. While matrix effects are well documented in techniques like mass spectrometry or chromatography [9], they remain relatively unexplored in UV-Visible absorption spectroscopy, especially in the context of complex commercial products. This is likely due to the simplicity and routine nature of UV-Vis analysis, which is often used under the assumption of minimal interference [8].
However, this assumption does not always hold true. To explore this, matrix effects were investigated in a real commercial product. Listerine Protection for Teeth and Gum® (LPTG), a green colour mouthwash that contains Fast Green FCF (green/blue dye) and Quinoline Yellow QY (yellow dye). Listerine provides an ideal case study because it contains both dyes in the same matrix, which allows a direct comparison of their behavior under identical conditions.
To assess how these dyes respond to matrix effects, two analytical methods were adopted:
External calibration, a widely used technique that is fast and convenient but vulnerable to matrix interference [8];
Standard addition, a method designed to account for matrix effects whereby the sample is spiked with known quantities of analyte and the result is extrapolated [8,10].
These two approaches were used to determine the concentrations of each dye in the Listerine matrix. By comparing the results obtained from both methods, it is possible to:
Evaluate the presence and magnitude of matrix effects;
Investigate whether some dyes are more sensitive to matrix effects than others.
2 Materials and methods
2.1 Materials
2.1.1 Chemical compounds
Distilled water was used as a solvent. QY (CAS 8004-92-0, CI 47005 [11], see Fig. 1) and FCF (CAS 2353-45-9, CI 42053 [12], see Fig. 1) were respectively purchased from Prolabo and Roth and used without further purification. They were only used in the experiments involving external calibration.
Listerine® products purchased from a supermarket were used. Two products from the range were used, Listerine Protection for Teeth and Gum®, which will hereafter be referred to as LPTG was used because it contains both QY and FCF. Listerine Intense Freshness®, which will hereafter be referred to as LIF, was used because it only contains FCF.
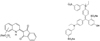 |
Fig. 1 QY (left) and FCF (right) dyes structure. |
2.1.2 Measuring instrument
The UV-Visible Spectrophotometer used to determine the absorption of the solutions is Easyspec and it was purchased from Safas. The cuvettes used are made of plastic and they are 1 cm wide.
2.2 Methods
2.2.1 Preparation of stock solutions
Stock solutions of the dyes were prepared at known concentrations by diluting commercial dye solutions. For the FCF Blue dye, 25.0 μL of the commercial solution were diluted with distilled water in a 10.0 mL volumetric flask, which resulted in a final concentration of 2.74 × 10 −4 mol.L−1. For the QY dye, the same procedure was adopted: 25.0 μL of the commercial solution were diluted to 10.0 mL with distilled water, yielding a final concentration of 1.3 × 10 −3 mol.L−1. These stock solutions were subsequently used in both the external calibration and standard addition procedures. The concentration ranges covered are presented in Table A1 for FCF and in Table A2 for QY.
2.2.2 External calibration
2.2.2.1 Experimental procedure
Absorbance values at a given wavelength were plotted as a function of dye concentration to generate a calibration curve, in accordance with the Beer-Lambert law. The dye concentration of QY and FCF in LPTG was then determined using the absorbance measured under the same conditions.
In this experiment, the external calibration method was employed to quantify the dye concentrations in LPTG. A plastic cuvette was filled with 2.00 mL of distilled water. 10.0 μL of the stock solution were added several times. To ensure homogeneity, the cuvettes were mixed after each addition, manually by inversion. After each addition, the absorbance spectrum was recorded over the range of 350 to 750 nm. This procedure was repeated for a total of eight additions.
2.2.2.2 Use of results
For the external calibration method, the concentration of the dye in LPTG was determined using an absorbance measurement. For each standard addition, the absorbance at the wavelength of maximum absorbance for the dye was extracted from the recorded spectrum. These values were plotted as a function of the corresponding dye concentrations in order to obtain a calibration curve. A linear regression was performed to obtain the slope and intercept of the line. The absorbance of the LPTG sample, measured under identical conditions, was then used with the calibration equation to calculate the dye concentration.
The uncertainty associated with the dye concentration determined with the external calibration method was estimated based on the propagation of uncertainties. The concentration was calculated using the equation of the calibration line  , where As is the absorbance of the sample, a is the slope, and b is the intercept. In the rest of the study, the intercept will be taken as zero. The main sources of uncertainty considered were the uncertainty about the absorbance measurement and the uncertainty about the slope obtained from the linear regression. A relative uncertainty of 1% was assigned to all absorbance values, based on the spectrophotometer specifications. This uncertainty was used to define the vertical error bars on the calibration graph. The uncertainty about the concentration values (x-axis) was considered negligible, due to the use of accurately known stock solutions and precisely measured volumes (around 2 % of systematic error).
The quality of the linear model was assessed by examining two main criteria:
The coefficient of determination r2, which quantifies the proportion of variance in the absorbance provided by the model. A value of r2>0.99 was considered indicative of a strong linear correlation.
The distribution of standardized residuals, which was evaluated to check for randomness and the absence of systematic deviations. The plot of the residuals was visually inspected to ensure that the residuals were normally distributed and randomly scattered around zero.
The combined standard deviation u(C) of the concentration was calculated using the following formula:

where u(As) is the standard deviation of the absorbance and u(a) is the standard deviation of the slope.
2.2.3 Standard addition
2.2.3.1 Experimental procedure
The resulting calibration curve follows the Beer-Lambert law. It was then extrapolated to determine the initial concentration of the analyte in the sample.
In this experiment, the standard addition method was employed to quantify the concentration of dyes in LPTG. A plastic cuvette was filled with 2.50 mL of the sample solution (LPTG in this case), and successive additions of 10.0 μL of a standard dye solution were made. The standard solutions used were identical to those prepared for the external calibration method. To ensure homogeneity, the cuvettes were mixed after each addition, manually by inversion. After each of the eight additions, the absorbance spectrum was recorded over the range of 350 to 750 nm. The concentration ranges covered are presented in Table A1 for FCF and in Table A2 for QY.
2.2.3.2 Use of results
In the standard addition method, the initial dye concentration in the LPTG sample was obtained by extrapolating the calibration line to the x-axis. The x-intercept corresponds to the negative of the initial concentration of the analyte. The equation used is:

where a is the slope and b the intercept of the calibration line, which was obtained using a linear regression. Since the intercept was determined using the fit and not directly using an experimental measurement, and the absorbance values are not associated with a significant uncertainty in this context, only the uncertainty about the slope was considered in the propagation.
The standard deviation of the concentration, u(C), was calculated as:

where u(a) is the standard deviation of the slope obtained with the regression analysis.
2.2.4 Comparison of the methods
The concentrations of the dyes in LPTG obtained with both the external calibration and standard addition methods were compared to evaluate the presence of matrix effects. To assess the agreement between the two methods, a Z-score was calculated using the concentrations and their associated standard deviations.
To ensure the reliability and repeatability of the measurements, each analytical method was employed in triplicate for both dyes. Repeating the experiment under the same conditions allows for the evaluation of the precision of the method and provides a better estimate of the experimental deviations. The average concentration and corresponding standard deviations were calculated using the three replicates for each method and dye.
The Z-score was calculated using the following equation :

where C1 and C2 are the concentrations determined with the external calibration and standard addition methods, respectively, and u(C1) and u(C2) are their associated standard deviation.
A Z-score with an absolute value below 2 indicates that the two methods yield statistically consistent results, and therefore that no significant matrix effect is noted. Conversely, a Z-score greater than 2 in absolute value suggests a significant difference between the two methods, which suggests that matrix components may interfere with the absorbance measurements or the quantification of the dyes.
3 Results and discussion
3.1 Preliminary study
To employ the different assay methods it is necessary to determine the wavelengths corresponding to the maximum absorption for each dye. Figure 2 represents the absorption spectra of LPTG, LIF (which contains only FCF as dye, so as to observe the same matrix effects as the LPTG ones), QY in water and FCF in water.
Concerning these spectra, it is important to underline that the concentrations and volumes used are not known, as the aim was to obtain spectra with qualitative rather than quantitative data. The wavelengths corresponding to the maximum absorption is 626 nm for FCF and 417 nm for QY. However, FCF also presents a second intense band at 417 nm. This cumulative absorption at 417 nm is problematic while assaying QY. On the one hand, FCF can be measured independently because of its absorption band at 626 nm, which is not superimposed on another band. On the other hand, QY absorbs at only one wavelength (417 nm), which is common to green dyes. It is therefore necessary to identify the proportion of FCF present in the yellow absorption band in LPTG in order to determine the real absorbance of QY at 417 nm and thus make it possible to return to its concentration in the mouthwash. Actually, when absorbance is measured using spectrometry, the absorbance is cumulative, which means that the absorbance determined is due to the contribution of all the absorbing species at a given wavelength. Absorbance cannot be directly deconvoluted, which is why it is necessary to carry out a preliminary study to determine the proportions of the different species.
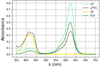 |
Fig. 2 Absorption spectra of LIF, LPTG, FCF and QY in water. |
3.2 Study of FCF
To initiate the study, the LPTG assay was performed using external calibration (Fig. 3) and standard addition (Fig. 4).
Figure 3 represents the assay of FCF in LPTG using external calibration. The lower absorption spectrum corresponds to that of the less concentrated solutions of FCF in water. Each new spectrum (in the direction of the arrow) corresponds to the addition of 10 μL of FCF at a concentration of 2.74 × 10⁻⁴ mol.L−1. The concentrations of the different solutions are presented in Table A1 in the appendix.
The spectra in Figure 3 feature two absorption bands with maxima at 417 nm and 626 nm. The band at 417 nm is weak, absorbance does not exceed 0.10 for 1.6 × 10⁻⁵ mol.L−1 of FCF, while that at 626 nm is strong, absorbance is greater than 0.5 for 1.6 × 10⁻⁵ mol.L−1 of FCF. The absorbance of LTPG at 626 nm is 0.36.
The second experiment carried out aimed to determine the concentration of FCF using standard addition. In Figure 4, the lower absorption spectrum corresponds to that of LPTG. Each new spectrum (in the direction of the arrow) corresponds to the addition of 10 μL of FCF at a concentrations of 2.5 × 10⁻⁴ mol.L−1 mol.L−1. The concentration of the different solutions are shown in Table A1.
Again, this spectrum features two absorption bands with maxima at 417 nm and 626 nm. Unlike Figure 3, where absorbance at 417 nm does not exceed 0.10, here the band is medium (up to 0.40 absorbance) because the dosage is carried out directly in LPTG and at 417 nm there is the presence of the absorption of QY. The band at 626 nm remains strong and absorbance increases up to 0.80.
Based on the data obtained with the previous experiments, the concentration of FCF in LPTG is now determined. Figure 5 shows the linear modelling of Beer Lambert's law for standard addition and external calibration. The values of LPTG are added in black in the external calibration straight line.
The concentrations obtained using various analytical methods are shown in Table 1.
To compare the two concentrations, a Z-score is calculated with the formula explained in 2.2.3.2. The Z-score linked to these two concentrations is 1. This suggests that no matrix effects can be observed, indicating that no correction is necessary.
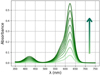 |
Fig. 3 Absorption spectra of FCF in water at concentrations ranging from 1.36 × 10⁻⁶ to 1.06 × 10⁻⁵ mol.L−1(external calibration). |
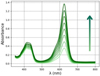 |
Fig. 4 Absorption spectra of the solution obtained by adding 10 μL of FCF (2.5 × 10⁻⁴ mol.L−1) to LPTG, at final concentrations ranging from 1.09 × 10⁻⁶ to 8.55 × 10⁻⁶ mol.L−1 (standard addition). |
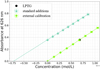 |
Fig. 5 Determination of FCF concentration (for λ = 626 nm) in LPTG using either standard addition or external calibration. The straight lines for standard additions are due to the numerical fit. |
Results for FCF in LPTG.
3.3 Study of QY
To investigate this phenomenon further, the LPTG assay was conducted using both external calibration and standard addition methods. Figure 6 represents the assay of QY in LPTG using the external calibration. The first absorption spectrum (at the very bottom line of Fig. 6) corresponds to that of the less concentrated solutions of QY in water. Each new spectrum (in the direction of the arrow) corresponds to the addition of 10 μL of QY at a concentration of 1.3 × 10⁻³ mol.L−1. The concentrations of the different solutions are presented in Table A2 in the appendix.
This spectrum features one absorption band with maxima at 417 nm. The absorbance exceeds 1.75 for 4.99 × 10⁻⁵ mol.L−1 of QY. The uncorrected absorbance of LTPG at 417 nm is 0.35.
The second experiment carried out aimed to determine the concentration of QY using standard addition. In Figure 7, the lowest spectrum corresponds to that of LPTG. Each new spectrum (in the direction of the arrow) corresponds to the addition of 10 μL of QY at a concentration of 1.3 × 10⁻³ mol.L−1.The concentrations of the different solutions are presented in Table A2.
Unlike Figure 6, this spectra features two absorption bands with maxima at 417 nm and 626 nm. The one at 626 nm is due to the FCF present in the LPTG matrix.
The calibration curves of QY were drawn the same way as those of FCF where, using the spectra at a 417 nm wavelength.
Based on the data obtained with the previous experiments, the concentration of QY in LPTG is now determined. The graphs below show the linear modelling of Beer Lambert's law for standard addition and external calibration.
For the standard addition, the straight line obtained with the uncorrected values is represented by the squares in Figure 8. The measurements were then corrected using the following method.
To calculate the relative proportions of the FCF absorption bands, Equation 1 was used:

where As is the absorbance at a given wavelength in LIF. F is equal to 0.12. This factor was then used to subtract the amount of FCF present in the band at 417 nm in LPTG during the assay of QY.
As mentioned in 3.1, the study of QY in LPTG has to include a correction on their absorbance values because of the absorbances superimposing at 417 nm. The absorbance of FCF has to be subtracted in order to determine the concentration of QY in the product. The formula below was used to calculate the corrected absorbance of QY:
AsQY(417 nm) = Astot(417 nm) - F * Astot(626 nm)
AsQY(417 nm) is the contribution of QY in the absorbance of LPTG at 417 nm. Astot(417 nm) is the contribution of both dyes in LPTG at 417 nm.
The straight line obtained with the corrected values is represented by the triangles in Figure 8. The values of LPTG are added in red in the external calibration straight line.
The concentrations obtained using various analytical methods and the comparison between the values obtained with and without correction are presented in Table 2.
Matrix effects are thus observed, without but not with the application of corrections. These effects must therefore be taken into account to determine the real concentration of QY in LPTG.
To evaluate whether it is important to remove the contribution of FCF at 417 nm, Z-scores were calculated between the concentrations obtained with and without correction for both calibration methods. A Z-score value greater than 2 indicates that the difference is statistically significant Specify the values. As shown in Table 2, the Z-scores confirm that the concentrations differ beyond experimental uncertainty in both cases. Therefore, applying a correction to the absorbance values is necessary for both methods.
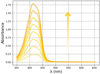 |
Fig. 6 Absorption spectra of QY in water at concentrations ranging from 6.47 × 10⁻⁶ to 4.94 × 10⁻⁵ mol.L−1(external calibration). |
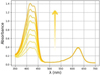 |
Fig. 7 Absorption spectra of the solution obtained by adding 10 μL of QY (1.3 × 10⁻³ mol.L−1) to LPTG, at final concentrations ranging from 5.17 × 10⁻⁶ to 4.04 × 10⁻⁵ mol.L−1 (standard addition). |
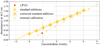 |
Fig. 8 Determination of QY concentration in LPTG for λ = 417 nm using either the standard addition or the external calibration. The straight lines for the standard addition are due to the numerical fit. |
Results for QY in LPTG.
3.4 Discussion
In this study, two dyes have been analysed in the same matrix (LPTG). Matrix effects are observed in the case of QY, but not in the case of FCF. As both studies were carried out in the same matrix, It can be concluded that matrix effects arise not only from the environment but also from specific interactions with the analyte. In this study, the two dyes examined have very different structures due to the presence of various chemical functions. Similarly, the matrix is very complex, making it difficult to determine which molecules influence the properties or even whether the ionic strength of the solution has an influence. TD-DFT calculations could provide a better understanding of the influence of the solvent on the optical properties of the different components.
4 Dead end
Several inconsistencies were observed in the spectra obtained using the standard addition method. For example the absorbance did not evolve proportionally with the quantity of dye added during our first step of experiments, not presented into this article. These discrepancies were primarily attributed to inaccuracies in micropipette calibration and insufficiently rigorous handling of the experimental equipment.
In an initial attempt to separate and identify QY and FCF in the LPTG sample, thin-layer chromatography was employed using eluents composed of varying ratios of water and ethanol. Although water was used as the sample solvent, the method proved ineffective: FCF, due to its high polarity, exhibited minimal migration, which prevented effective separation of the two dyes.
5 Conclusion
This study demonstrates that matrix effects in Listerine can induce significant biases in the quantification of QY and FCF concentrations. These effects are dye-dependent, suggesting that there are specific interactions between the matrix and individual components. For instance, the Z-score obtained from the comparison of the two analytical methods was 0.9 for the FCF dye, indicating a negligible influence of the matrix, whereas a Z-score of 12.5 was observed for the yellow dye, revealing a substantial matrix effect. Furthermore, due to the additive nature of absorbance in this analytical approach, the deconvolution of the individual absorbance contributions from each dye is required to ensure accurate quantification. To further characterize matrix effects, future studies could examine the behavior of a single dye across various matrices, using the same analytical protocols.
Notably, our results, although they did not rely on using statistical normalization such as Z-scores, suggest that Quinoline Yellow (yellow dye) is more affected by matrix effects than Fast Green FCF (green/blue dye). This highlights the importance of method selection and matrix consideration in UV-Vis analyses of commercial formulations.
Data availability statement
The data associated with this article can be found in this Zenodo repository: https://zenodo.org/records/20275891.
References
- M. Kucharska, J. Grabka, A Review of chromatographic methods for determination of synthetic food dyes, Talanta 80, 1045–1051 (2010) [Google Scholar]
- F. Karami, A. Shokrollahi, Simultaneous preconcentration of fast green FCF and rhodamine B using deep eutectic solvent and determination via high-performance thin layer chromatography, J. Anal. Methods Chem. 2023, 8797355 (2023) [Google Scholar]
- Regulation - 1223/2009 - EN - Cosmetic Products Regulation - EUR-Lex, Accessed June 7, 2025. https://eur-lex.europa.eu/eli/reg/2009/1223/oj/eng [Google Scholar]
- Directive - 94/36 - EN - EUR-Lex, Accessed June 7, 2025. https://eur-lex.europa.eu/eli/dir/1994/36/oj/eng [Google Scholar]
- S. Lehto, M. Buchweitz, A. Klimm, R. Straßburger, C. Bechtold, F. Ulberth, Comparison of food colour regulations in the EU and the US: A review of current provisions, Food Addit. Contam.: Part A 34, 335–355 (2017) [Google Scholar]
- M.A. Ali, S.A. Bashier, Effect of fast green dye on some biophysical properties of thymocytes and splenocytes of Albino Mice, Food Addit. Contam. 23, 452–461 (2006) [Google Scholar]
- A. Kemp, Food additives and hyperactivity, BMJ 336, 1144–1144 (2008) [Google Scholar]
- A. Skoog, F. Holler, S. Crouch, Principles of instrumental analysis, 7th ed. Cengage Learning, 2017 [Google Scholar]
- B.K. Matuszewski, M.L. Constanzer, C.M. Chavez-Eng, Strategies for the assessment of matrix effect in quantitative bioanalytical methods based on HPLC−MS/MS, Anal. Chem. 75, 3019–3030 (2003) [Google Scholar]
- Ellison, L.R. Stephen, M. Thompson, Standard additions: myth and reality, Analyst 133, 992–997 (2008) [Google Scholar]
- Roth, Safety Data Sheet Safety Data Sheet Acc. to Regulation (EC) No. 1907/2006 (REACH) Quinoline Yellow (C.I. 47005), n.d. [Google Scholar]
- Roth, Safety Data Sheet Safety Data Sheet Acc. to Regulation (EC) No. 1907/2006 (REACH) Fast Green FCF for Microscopy. [Google Scholar]
Cite this article as: Charline Taralle, Lou Breuilly, Sherin Adam, Fantine Moccelin, Clara Marin–Alemanni, Rachel Méallet, Jonathan Piard, Why matrices matter: investigating dye quantification in listerine® with UV-Visible spectroscopy, Emergent Scientist 10, 1 (2026), https://doi.org/10.1051/emsci/2026001
Appendix
Ingredients of LPTG ® products: Aqua, Alcohol, Sorbitol, Poloxamer 407, Benzoic Acid, Sodium Fluoride, Eucalyptol, Zinc Chloride, Sodium Saccharin, Methyl Salicylate, Thymol, Aroma, Menthol, Sodium Benzoate, CI 42053, CI 47005)
Ingredients of LIF ® products: Aqua, Alcohol, Sorbitol, Poloxamer 407, Benzoic Acid, Sodium Saccharin, Eucalyptol, Methyl Salicylate, Thymol, Sodium Benzoate, Menthol, Aroma, CI 42053)
Concentrations of FCF associated with the different additions for the standard addition method and for external calibration method.
Concentrations of QY associated with the different additions for the standard addition method and for external calibration method.
All Tables
Concentrations of FCF associated with the different additions for the standard addition method and for external calibration method.
Concentrations of QY associated with the different additions for the standard addition method and for external calibration method.
All Figures
|
Fig. 1 QY (left) and FCF (right) dyes structure. |
| In the text | |
|
Fig. 2 Absorption spectra of LIF, LPTG, FCF and QY in water. |
| In the text | |
|
Fig. 3 Absorption spectra of FCF in water at concentrations ranging from 1.36 × 10⁻⁶ to 1.06 × 10⁻⁵ mol.L−1(external calibration). |
| In the text | |
|
Fig. 4 Absorption spectra of the solution obtained by adding 10 μL of FCF (2.5 × 10⁻⁴ mol.L−1) to LPTG, at final concentrations ranging from 1.09 × 10⁻⁶ to 8.55 × 10⁻⁶ mol.L−1 (standard addition). |
| In the text | |
|
Fig. 5 Determination of FCF concentration (for λ = 626 nm) in LPTG using either standard addition or external calibration. The straight lines for standard additions are due to the numerical fit. |
| In the text | |
|
Fig. 6 Absorption spectra of QY in water at concentrations ranging from 6.47 × 10⁻⁶ to 4.94 × 10⁻⁵ mol.L−1(external calibration). |
| In the text | |
|
Fig. 7 Absorption spectra of the solution obtained by adding 10 μL of QY (1.3 × 10⁻³ mol.L−1) to LPTG, at final concentrations ranging from 5.17 × 10⁻⁶ to 4.04 × 10⁻⁵ mol.L−1 (standard addition). |
| In the text | |
|
Fig. 8 Determination of QY concentration in LPTG for λ = 417 nm using either the standard addition or the external calibration. The straight lines for the standard addition are due to the numerical fit. |
| In the text | |
Current usage metrics show cumulative count of Article Views (full-text article views including HTML views, PDF and ePub downloads, according to the available data) and Abstracts Views on Vision4Press platform.
Data correspond to usage on the plateform after 2015. The current usage metrics is available 48-96 hours after online publication and is updated daily on week days.
Initial download of the metrics may take a while.