| Issue |
Emergent Scientist
Volume 8, 2024
|
|
|---|---|---|
| Article Number | 1 | |
| Number of page(s) | 18 | |
| Section | Chemistry | |
| DOI | https://doi.org/10.1051/emsci/2023004 | |
| Published online | 25 January 2024 | |
Research Article
Fluorescence emission modification of triphenylamine derivatives by aggregate formation in solution or by mechanical stress in solid state
Université Paris-Saclay,
91400,
Orsay, France
2
Université Paris-Saclay, ENS Paris-Saclay,
DER Chimie,
91190,
Gif-sur-Yvette,
France
* e-mail: This email address is being protected from spambots. You need JavaScript enabled to view it.
Received:
4
May
2023
Accepted:
25
November
2023
Abstract
Two derivatives of triphenylamine, 4-(diphenylamino)benzaldehyde and 2-(4- (diphenylamino)benzylidene)malononitrile, with acceptor mesomeric groups, an aldehyde moiety and a dicyanovinyl group respectively, were synthesized and found to have aggregation-induced emission (AIE) or aggregation-induced enhanced emission (AIEE) properties in several DMF/H2O mixtures. The size of the formed aggregates was studied with Dynamic Light Scattering (DLS) and a significant change of approximately 200 nm was observed according to the water fraction in DMF. Mechanoluminochromism characteristics in the solid state were also observed. A shift in the emission bands was noticed when comparing the solid before and after grinding, as well as when comparing the crystalline and amorphous form.
Key words: AIE / AIEE / Fluorescence / Mechanoluminochromism / Triphenylamine
© L. Estournet et al., published by EDP Sciences, 2024
 This is an Open Access article distributed under the terms of the Creative Commons Attribution License (https://creativecommons.org/licenses/by/4.0), which permits unrestricted use, distribution, and reproduction in any medium, provided the original work is properly cited.
1 Introduction
Organic molecules able to change their interaction with light according to external stimuli have aroused interest for a long time due to their possible and diverse applications in sensors, data storage tools and data protection [1,2]. Mechanoluminochroms are part of these types of organic molecules whose color of luminescence changes when pressure is applied on the solid state [3]. As quenching, and more precisely self-quenching, allows other pathways of deexcitation for molecules with large delocalization, a phenomenon known as ACQ (aggregation-caused quenching), the solid state or the thin film state of such molecules generally have little to no luminescent properties [4]. However, a new category of molecules was firstly reported in 2001 to display aggregation-induced emission (AIE) and aggregation-induced enhanced emission (AIEE) [5,6]. In the case of AIEE, the compound displays a shifted, higher intensity fluorescence in the aggregated state than in solution. AIE luminogens have been used as a basis for potential mechanofluorochroms [7,8]. A correlation between AIE properties and piezofluorochromism has been indeed identified (PAIE: piezofluorochromic aggregation-induced emission) as the two properties are often coupled [9,10]. Since PAIE luminogens as well as AIE
luminogens and mechanoluminochroms change color quite drastically, researchers have been investigating whether a gradual change in color is possible [11–13].
The derivatives of pyrene or triphenylamine are the most commonly studied molecules in this context because of their strong AIE properties. Due to their aggregation, the geometries of the electronic ground state and excited states are modified and the restriction of intramolecular rotations between some groups leads to a decrease in the nonradiative decay rate. The modification of the luminescence of organic molecules such as triphenylamine 1 is due to changes in the electronic properties of the ground state and the excited state and this effect is enhanced with the delocalisation of the electronic density over the π system [14]. It could therefore be interesting to add specific functions to triphenylamine 1 to investigate their effect on the luminescence (AIE, AIEE and mechanoluminochromism) of the new compound. The two molecules, 4-(diphenylamino)benzaldehyde 2 and 2-(4-(diphenylamino)benzylidene)malononitrile 3 (Scheme 1), chosen for their acceptor mesomeric groups, were studied by Cao et al. [10], who investigated modifications in their luminescence under grinding, annealing or solvent fuming. AIE or AIEE properties were studied with mixtures made with different water fractions in dimethylformamide (DMF), but no correlation was established between the fluorescence properties and the size of aggregates formed in solution. This study aims to compare the luminescence properties in solution and in the solid state (crystalline and amorphous states) of the two derivatives. It also endeavors to find a correlation between the size of aggregates formed in solution and the emission intensity.
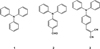 |
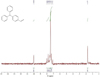
Scheme 1 Chemical structures of compounds 1–3. |
2 Material and method
In the following study, the acronyms cr, gr and am stand respectively for crystalline, grinded and amorphous, referring to the state of the solid compounds. The studied 1 and 2 solids are supposed to be initially crystalline.
2.1 General method
Absorbance spectra were recorded with a Libra S12 biochrom spectrophotometer. The emission and excitation spectra of the solutions were recorded in a 1 cm path length quartz cuvette with a Cary Eclipse Varian fluorimeter (Appendices 1 and 2). The emission and exci-tation spectra of the solids deposited on a glass slide were recorded with a Xenius Safas Monaco spectrophotometer. NMR spectra were recorded with a Spinsolve Carbon benchtop NMR spectrometer (80 MHz) from Magritek. IR spectra were recorded with a Nicolet Avatar 330 FT-IR spectrometer from Thermo Fischer Scientific. To obtain amorphous phase solids 1am, 2am and 3am, a sample of each compound, 1, 2 and 3, was deposited on a glass slide, melted on a Kofler bench, and quickly solidified or not, after removing the glass slide from the bench. Light scattering (DLS) measurements were recorded on the DMF/H2O solutions of 2 and 3 with a Zetasizer nano series Malvern apparatus in a 1 cm length quartz cuvette. The parameters of the apparatus were the following: water as dispersant; temperature of 25 °C; automatic mode. Water was chosen as the dispersant since it is the major solvent in the mixture. The spectra plotted in this study were corrected using the Arrhenius viscosity model (1) for solvents (DMF/H2O) and the Stokes-Einstein law (2). The formulas used were the following:
 (1)
(1)
 (2)
(2)
with η, ηH2O, ηDMF the dynamic viscosity of the mixture, H2O and DMF, respectively (in mPa.s). The viscosities of H2O and DMF were obtained from the literature [15,16] and were assumed to have the following values: ηH2O = 0.890 mPa.s and ηDMF = 0.801 mPa.s, at 25 °C. xH2O and xDMF correspond to the molar fractions of H2O and DMF respectively (with xDMF + xH2O = 1). D, kB, T and d are, respectively, the diffusion coefficient of the particle (m2.s−1), the Boltzmann constant (J.K−1), the temperature (K) and the hydrodynamic diameter of the particle (m). The hydrodynamic diameters plotted on the spectra, dspectra, were therefore obtained by combining equations (1) and (2) to convert dDLS, the hydrodynamic diameters obtained as DLS output, according to equation (3):
 (3)
(3)
2.2 AIE and AIEE study
For each compound, commercial 2 (Tokyo Chemical Industry, Zwijndrecht Belgium) and synthesized 3, a range of H2O/DMF solutions (100 mL) were prepared using distilled water and purchased DMF (Carlo Erba, Val de Reuil, France), at a concentration of C2,0 = 22.9 µmol.L−1 and C3,0 = 19.0 µmol.L−1, respectively. The commercial compound 2 was used because these experiments were carried out in parallel with the synthesis of compound 2. As AIE phenomena are particularly sensitive to their environment, the commercial product made it possible to reduce the apparition of impurities in the spectra. The following water volume fractions were tested in the H2O/DMF mixtures: 0%, 25%, 50%, 75%, 90%, 95% and 99%. For each 2 or 3 solution, emission and excitation spectra were recorded. DLS measurements were carried out for the following water volume fractions: 75% – 99% and 75% – 95%, for 2 and 3, respectively.
2.3 Theoretical calculations
The molecular structures of 1 , 2 and 3 were optimized using the density functional theory (DFT) with the Coulomb Attenuating Method Becke’s three-parameter exchange, Lee, Yang, and Parr correlation hybrid functional (CAM-B3LYP), commonly used for the prediction of excited states of molecules with intramolecular charge transfer, in combination with the 6-31G(d,p) basis set, using Gaussian 16. Then, the oscillator strengths for the two first electronic excited states were calculated for all derivatives employing time-dependent DFT (TD-DFT) at the CAM-B3LYP/6-31G(d,p) level of theory. Solvent effects were taken into account through the polarizable continuum model (PCM) using either water (dielectric constant: ɛH2O = 78.355) or N,N-dimethylformamide (ɛdmf = 37.219). We recall that the oscillator strength, fif, is a dimensionless quantity which expresses the probability of absorption or emission of an electromagnetic radiation between the initial electronic state |ψi) and the final excited electronic state |ψf). It can be defined as follows:
 (4)
(4)
where ω is the frequency of the applied electromagnetic field and 〈ψf|r|ψi〉 is the matrix element of the transition dipole moment between the electronic states |ψi〉 and |ψf〉. The latter represents the degree of spatial overlap between the wave functions of these states.
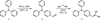 |
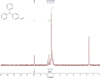
Scheme 2 Synthesis pathways of the derivatives of triphenylamine 1. |
2.4 Syntheses
Hazard classes, category codes and suppliers of the used chemicals are mentioned in Appendix 3.
Scheme 2 shows the synthesis pathways described below.
2.5 4-diphenylamino-benzaldehyde (2)
Triphenylamine 1 (4.9625 g, 20.23 mmol) was dissolved in DMF (8.5 mL, 109 mmol). Phosphorus oxychloride (3.4 mL, 18.3 mmol) was added dropwise, and the mixture was stirred and heated at 100 °C for 1 h. The reaction was monitored by TLC (Thin Layer Chromatography) (eluent: petroleum ether/AcOEt 99:1). After cooling, the mixture was dissolved in CH2Cl2 (50 mL) and washed with a dilute sodium hydrogen bicarbonate solution (2 × 50 mL), and then with distilled H2O (25 mL). The organic fraction was dried over MgSO4, filtered, and concentrated in vacuo. Column chromatography eluting with CH2Cl2 provided the title compound 2 (1.1153 g, yield = 20%) as light-yellow crystals, m.p. (melting point) 135–136 °C. 1H NMR (80 MHz, CDCl3) δ 9.93 (s, 1H, CHO), 7.02 – 7.91 (m, 14H, Ph). IR (solid state): 1690 cm−1 (CHO), 3040 cm−1 (Ph).
2.6 2-(4-(diphenylamino)benzylidene)malononitrile
Commercial 4-diphenylamino-benzaldehyde 2 (1.0 g, 3.6 mmol) was added to the ethanol solution (60 mL) of malononitrile (0.3 g, 5.4 mmol). The mixture was stirred at 60 °C and the reaction was monitored by TLC (eluent: CH2Cl2). After 2 h, the reaction was complete and the mixture was cooled down to room temperature. After a step of trituration in petroleum ether, an orange powder was obtained through vacuum filtration (0.646 g, yield = 55%), m.p. 143 °C. 1H NMR (80 MHz, CDCl3) (Cf. Dead End). IR (solid state): 1591 cm−1 (C=C), 2220 cm−1 (CN), 3053 cm−1 (Ph). The NMR and IR spectra of the products are reported in Appendices 4–8.
3 Results and discussion
3.1 AIE and AIEE study
The emission spectra of 2 and 3 in several DMF/H2O mixtures with different water volume fractions are reported in Figures 1a and 2a, respectively.
Regardless of the composition of the DMF/H2O mixture, the emission spectrum of compound 2 are at lower wavelengths, and therefore higher energies, than for compound 3. This red shift is probably due to the increase in the conjugation system from 2 to 3, but also because the dicyanovinyl group is more electron-withdrawing than the aldehyde [17,18]. To determine the influence of the acceptor mesomeric groups of 2 and 3 on the relative positions of their emission bands, quantum chemical calculations were performed to examine the shape of the frontier molecular orbitals.
A decrease in the HOMO-LUMO energy gap by increasing the attractive character of the substituents was obtained with the theoretical calculations (Appendix 9). The lower this gap, the more the spectra will shift at high wavelengths, therefore towards the red. The observed red shift was also rationalized in the ground state with the increase in the electric dipole moment from derivative 1 to 3 (Appendix 10). Considering the HOMO-LUMO transition, a notable redistribution of the electronic density in the LUMO shape compared to that of the HOMO was observed over the aldehyde group of compound 2, and even more pronouncedly over the dicyanovinyl group of 3, which further supports the higher electron-attractivity of the latter (Appendix 9). Moreover, the energy of the first excited state clearly exhibited a greater red shift for 3 owing to the more pronounced electron-withdrawing nature of the dicyanovinyl group compared to the aldehyde. However, the hypothesis asserting that a more pronounced red shift takes place with the more electron-attracting groups remains valid solely when the geometry of the excited state closely resembles that of the ground state, and when the observed transition corresponds to the HOMO-LUMO transition.
Additionally, it is noteworthy that the implicit consideration of solvation in water or DMF reduced the HOMO-LUMO energy gap by approximately 0.10 eV for 2, and 0.12 eV for 3 (Appendix 9). Taking into account the solvation also reduced the energy of the first excited state for molecule 3 by approximately 0.2 eV, while it had no effect on the second excited state. It is difficult however to confirm a similar trend for molecule 2, since the first excited state calculated in the gas phase did not appear to be due to the same transition as in the solvent (Appendix 11). In fact, the first excited state for 2 in the gas phase was mainly due to the HOMO-2→LUMO transition, while it was the HOMO → LUMO transition in the solvent. Despite this particularity, if the HOMO → LUMO transition is tracked for 2, a behavior like that of the molecule 3 is visible: a red shift of more than 0.1 eV for the intense transition (with the higher oscillator strength) was observed for 2 when solvents are taken into account. On the other hand, for the least intense transition a blue-shift of almost 0.1 eV took place.
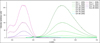
The AIEE property of 2 and the AIE property of 3 were studied. A form of AIEE was observed for 2 in the pure DMF solution (0% water): 2 was fluorescent with a maximum emission peak at 530 nm. When the water fraction was between 25% and 75%, the fluorescence of 2 disappeared. However, when the water fraction reached 75%, the fluorescence of 2 was recovered, blue shifted by approximately 60 nm (2274 cm−1). The emission intensity then drastically increased for water fractions between 75% and 99% to reach an intensity 6 times greater than that of the 75% water DMF/H2O mixture.
A relatively comparable phenomenon was observed for 3, but it was only AIE because 3 was not fluorescent in pure DMF (0% water). Starting from a water fraction of 50%, its emission intensity increased with a progressive red shift of the fluorescence maximum until the water fraction reached 95%. The effect of the increase in water fraction was greater for 2. The evolution of the fluorescence of the solutions of 2 and 3 was also visible to the naked eye (Fig. 3). As expected, a nonlinear progressive rise in their emission intensity was noticed. The obtained results were consistent with those reported in the literature [10].
The arrows in Figures 1a and 2a point out the evolution of the maximum wavelength for the fluorescence emission upon water volume fraction increase. Distinct behaviors for this evolution were observed for compounds 2 and 3. For 2, a slight shift was observed between 75% and 90% water fraction (from 468 nm/ 21 368 cm−1 to 473 nm/21 142 cm−1), but no distinguishable shift was visible from 90% to 99% water fraction. For 3, the more the water fraction increased, the more the maximum emission wavelength was red shifted (passing from 551 nm/ 18 149 cm−1 to 589 nm/ 16 978 cm−1).
The AIE and AIEE phenomena, and thus the presence of aggregates, were confirmed through DLS analysis after the viscosity correction. According to Figures 1b and 2b, aggregates with diameters of the order of 100 nm formed in the water-rich DMF/H2O mixtures. In the case of 2 (Fig. 1b and Table 1), there was an increase in the major hydrodynamic diameter of the aggregates from 146 nm to 398 nm for water fractions between 90% and 99%, with an increase in the width of the gaussian distribution.
This result suggests that the larger the aggregates, the higher the emission intensity: between 90% and 99% of water fraction, the maximal diameter increased by 173% and the maximum emission intensity by 141%. This trend may be due to a limited solubility of 2 in water: the more water there is, the bigger the aggregates are, since it might be energetically more favourable for 2 molecules to aggregate, rather than being in solution in the water-rich DMF/H2O mixture. Therefore, the higher the water fraction is, the larger the aggregates are, and the less the molecules in solution are free.
In the case of 3 (Fig. 1b and Table 1), the trend was the opposite of that of 2 between 90% and 95% water fractions: a decrease in the maximal diameter by 15% was observed, whereas an increase by 32% was recorded for 2 aggregates (Tab. 1). It could be suggested that the slight increase in the emission intensity of 3 (+4%) was due to the relatively small modification in the aggregate diameters between 90% and 95% of water fraction. On the contrary, the emission intensity increase was more pronounced for 2 (+63%), following the important modification in diameters between 90% to 95%. It seems that there is also a correlation between the size of the aggregates and the red shift, which would support the trend observed between 90% and 95%. Although the red shift for both compounds was of the same order of magnitude in terms of wavelength (2-3 nm), the red shift for compound 2 was 134 cm−1 , while it was 58 cm−1 for compound 3.
However, for a water fraction of 75%, an abrupt change occurred with a much more heterogenous and asymmetric diameter distribution, with a maximum at 363 nm for 2 and 3. For both compounds, the major hydrodynamic diameter had a high value of standard deviation compared to the other water fractions: 291 and 351 nm, for 2 and 3 respectively. The heterogeneity of the distribution could be due to a slower nucleation rate [19] because of a relative stabilization of the compounds by DMF molecules present at a non-negligible fraction of 25%. Indeed, if the nucleation rate is slow compared to the growth rate, the firstly formed nuclei grow while new nuclei are formed in parallel. The firstly formed nuclei lead therefore to the biggest aggregates, while the nuclei formed afterwards lead to smaller ones because there are less and less precursors (molecules 2 or 3) in the solution. The diameter distribution is therefore very broad. Regarding the different diameter distribution for a water fraction of 75% and since the results obtained with the four different mixtures are limited, it remains arduous to establish an overall trend. To determine a clear trend, a standard range of solutions with different DMF/H2O mixtures is required.
 |
Fig. 1 Study of 2 in DMF/H2O mixtures. a) Normalized emission spectra (λexc = 355 nm) with different water fractions (0% − 99%). Concentration of 2: C2,0 = 22.9 µmol.L−1. b) Distribution of hydrodynamic diameters of the formed aggregates of 2 for different water fractions (75% – 99%), measured with DLS. Concentration of 2: C2,0 = 22.9 µmol.L−1. |
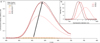 |
Fig. 2 Study of 3 in DMF/H2O mixtures. a) Normalized emission spectra (λexc= 435 nm) with different water fractions (0% – 95%). Concentration of 3: C3,0 = 19.0 µmol.L−1. b) Distribution of hydrodynamic diameters of the formed aggregates of 3 with different water fractions (75% – 95%), measured with DLS. Concentration of 3: C3,0 = 19.0 µmol.L−1. |
 |
Fig. 3 AIEE and AIE phenomena for the triphenylamine derivatives 2 and 3 as a function of the water volume fraction in the DMF/H2O mixture, under UV light (365 nm). |
Distribution of hydrodynamic diameters measured with DLS for 2 and 3 aggregates in DMF/H2O mixtures
3.2 Mechanoluminochromism
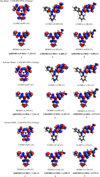
In the next stage, the fluorescent properties of the derivatives 2 and 3 in the solid state were determined: in their crystalline form, 2cr and 3cr, in the form obtained after grinding a sample with a pestle and a mortar, 2gr and 3gr, and in the amorphous form, 2am and 3am. The wavelengths of the maxima in the emission spectra (Appendices 12, 13 and 14) are summarized in Table 2. Emitted colors were cyan blue for 2cr and 2am and orange for 3cr and 3am (Fig. 4).
On the one hand, a trend can be observed. The emission spectra of the amorphous forms were significantly red shifted for both derivatives 2am and 3am (a shift of 21 nm/1 008 cm−1 and 27 nm/757 cm−1 respectively) compared to those of the crystalline forms.
A slight shift in wavelength was also noticed between the emission spectra of the crystalline form before and after grinding for each derivative (a 4 nm/203 cm−1 and 5 nm/145 cm−1 shift for 2 and 3 compounds respectively). Nonetheless, the two compounds had different behaviors when the crystalline form was grinded: the emission spectrum of 2gr was blue shifted (from 446 nm/22 422 cm−1 to 442 nm/22 624 cm−1), whereas that of 3gr was red shifted (from 584 nm/17 123 cm−1 to 589 nm/16 978 cm−1 ).
Besides, a slight shift can be observed compared to the reference values. The emission spectrum of 2gr displaying a blue shift was in contradiction with a previous study [10] in which grinded 2gr led to a red shift because an amorphous phase was obtained (Tab. 2). The difference in the direction of the shift may be due to the form observed after grinding. It may be suggested that the powder obtained in this experiment after grinding could be another crystalline form or could contain more defects than the crystalline one obtained after the synthesis. X-ray diffraction measurements may be carried out to verify whether the form obtained after grinding is still crystalline.
Although the shape and the width of the emission bands were quite similar before and after grinding in both cases (Table 2), the compounds 2 and 3 were found to have slight mechanoluminochromism properties and no mechanochemical ones.
Mechanochemistry involves a chemical modification of the molecule under mechanical stress, leading to a modification of the absorption spectra, which was not observed in this case: the compounds obtained after grinding had the same absorbance spectrum in solution as the compounds before grinding Appendices 12 and 13. In the case of 3, the spectrum of grinded solid (3gr) was located between the crystalline form ( 3cr) spectrum and that of the amorphous form (3am): it could be inferred that a part of the crystalline sample was transformed to the amorphous state [10].
Wavelengths and FWHM (Full Width at Half Maximum) of maximum emission bands for compounds 1–3 in the solid state (crystalline form, amorphous form, and after grinding).
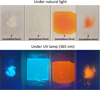 |
Fig. 4 Crystalline and amorphous forms of 2 and 3 under natural light and under UV light (365 nm). |
4 Dead End
4.1 Syntheses
For one reason or another, a sample of molecule 3, which was not studied, was not as pure as the other. To facilitate crystallization, the reaction medium was separated: one part was concentrated by evaporation of the solvent under reduced pressure and the other part was dissolved in petroleum ether to help recrystallization. The solid obtained after trituration in petroleum ether did not contain traces of the derivative with aldehyde while the one obtained after the evaporation of the solvent did.
The NMR spectrum of the obtained molecule 3 did not present the expected peaks. It may be possible to record the NMR spectrum in DMSO-D6 [10] or with a higher Larmor frequency, such as 300 or 400 MHz. However, the IR spectrum and the aspect of the product obtained were quite encouraging.
4.2 Characterisations
The AIEE study of 2 was performed at C2,0 = 22.9 µmol.L−1. At this concentration, it was possible to observe aggregation-induced enhanced emission for small fractions of DMF in water (1% to 25%). No aggregation-induced enhanced emission was observed at a lower concentration of C2,0/2, which means the concentration was not sufficient for the formation of aggregates (Appendix 15). The emission was quenched for a water fraction of 90%, which suggests that AIEE is concentration-dependent: a threshold concentration should be reached that 2 molecules could aggregate.
A correlation between the emission of 2 and 3 and the size of the aggregates could not be established because the results were limited. It would be necessary to perform stirring-controlled DLS measurements and to record emission spectra on a full range of mixtures with different water fractions. Stirring is crucial to prevent any coalescence. The fluorescence emission study with triphenylamine 1 did not provide any significant results in the solid state or in a DMF solution. For molecule 1, the first excited state is also predominantly due to the HOMO-LUMO transition but has a very low oscillator strength, which may explain the absence of emission. The AIE study of 1 was therefore not performed.
5 Conclusion
To conclude, two derivatives of triphenylamine 2 and 3 substituted with acceptor mesomeric groups were synthesized to investigate their photophysical properties. Both were found to have aggregated-induced or aggregated-induced enhanced emission properties in a DMF/H2O mixture. A notable red shift was observed between the emission spectra of 2 and 3 in solution and in solid state, which was larger for 3 due to the greater electron attractivity of the dicyanovinyl group compared to the aldehyde, as well as the increased conjugation. Solid crystalline forms 2cr and 3cr also displayed a slight mechanoluminochromic response to manual grinding. Moreover, their amorphous forms 2am and 3am were found to have a luminescence distinct from that of their crystalline forms 2cr and 3cr. The grinded sample 3gr might have partially become amorphous.
Since the emission spectra of 2 and 3 were close in their crystalline and grinded forms, X-Ray diffraction should be carried out on the solid samples to verify whether another solid form was obtained after grinding - either another crystalline form or an amorphous form - which would be responsible for mechanoluminochromism. Additional investigation is also required to determine the minimum solute concentration allowing the observation of the AIEE phenomenon. Besides, further studies could be carried out with a focus on the solvatochromism of the two synthesized derivatives 2 and 3. Finally, another possibility would be to synthesize a triphenylamine derivative with a donor group to observe its potential effects on the AIE mechanoluminochromic properties.
Acknowledgements
We would like to warmly thank Clémence Allain, Claire Lambard, Rachel Méallet, and Jonathan Piard for their valuable help and advice. The quantum chemistry calculations were made possible thanks to the help of Federica Agostini. We would like to thank the Chemistry Research Department of the ENS Paris-Saclay as well as its technical staff, Clément Doré, Sandrine and Pushpa Mourougayane for welcoming us and allowing us to use their equipment.
Appendices
 |
Appendix 1 Emission (Em) and excitation (Exc) spectra of 2 at C2,0 = 22.9 µmol.L−1 for different water fractions (0% – 99%) in DMF. Excitation and emission wavelengths (in nm) are specified in brackets. |
 |
Appendix 2 Emission (Em) and excitation (Exc) spectra of 3 at C3,0=19.0 µmol.L−1 for water fractions in DMF (0% – 95%). Excitation and emission wavelengths (in nm) are specified in brackets. |
 |
Appendix 3 Hazard classes, category codes and suppliers of the used chemicals. |
 |
Appendix 4 NMR spectrum of the commercial 4-diphenylamino-benzaldehyde 2 in CDCI3. |
 |
Appendix 5 NMR spectrum of the synthetised 4-diphenylamino-benzaldehyde 2 in CDCl3. |
 |
Appendix 6 IR spectrum of the synthetised 4-diphenylamino-benzaldehyde 2. |
 |
Appendix 7 IR spectrum of the commercial 4-diphenylamino-benzaldehyde 2. |
 |
Appendix 8 IR spectrum of the synthetised 2- (4- (diphenylamino) benzylidene) malononitrile 3. |
 |
Appendix 9 Molecular orbitals of triphenylamine 1 and its derivatives 2 and 3, calculated respectively in gas phase, with water and DMF implicit solvation with the TDDFT method, using the CAM-B3LYP functional and the basis set 6-31G(d,p) after an optimization of the geometry of the molecules in each environment at CAM-B3LYP/6-31G(d,p) level. |
 |
Appendix 10 Energy values, oscillator strength f, and electric dipole moment µ of the ground state obtained from TDDFT theoretical calculations for molecules 1, 2, and 3 in gas phase or considering the solvent implicitly. |
 |
Appendix 11 Molecular orbitals involved in the transitions to the first and second excited states in a mono-excitation approximation. |
 |
Appendix 12 Crystalline phase emission (Em) and excitation (Exc) spectra of 1. Solid phase emission spectrum of 1 after melting on a Kofler bench and rapid recrystallization (Em BK). |
 |
Appendix 13 Crystalline and amorphous (KB) phase emission and excitation spectra of 2. Com: commercial 2; BK: Kofler bench melted synthesized 2 which gave the amorphous phase after rapid solidification; grinded: grinded synthesized 2. Excitation and emission wavelengths are specified in brackets. |
 |
Appendix 14 Crystalline and amorphous (KB) phase emission and excitation spectrum of 3. KB: Kofler bench melted 3 which gave the amorphous phase after rapid solidification; grinded: grinded 3. Excitation and emission wavelengths are specified in brackets. |
 |
Appendix 15 Excitation (Exc) and emission (Em) spectra of 2 at C2,0/2 = 11.5 µmol.L−1 for different water fractions (1% – 90%) in DMF. Excitation and emission wavelengths (in nm) are specified in brackets. |
References
- M. Qayyum, T. Bushra, Z.A. Khan, H. Gul, S. Majeed, C. Yu, U. Farooq, A.J. Shaikh, S.A. Shahzad, Synthesis and tetraphenylethylene-based aggregation-induced emission probe for rapid detection of nitroaromatic compounds in aqueous media, ACS Omega 6, 25447–25460 (2021) [CrossRef] [Google Scholar]
- S. Majeed, T.A. Khan, M.T. Waseem, H.M. Junaid, A.M. Khan, S.A. Shahzad, A ratiometric fluorescent, colorimetric, and paper sensor for sequential detection of Cu2+ and Glutathione in food: AIEE and reversible piezo fluorochromic activity, J. Photochem. Photobiol. Chem. 431, 114062 (2022) [CrossRef] [Google Scholar]
- L. Wilbraham, M. Louis, D. Alberga, A. Brosseau, R. Guillot, F. Ito, F. Labat, R. Métivier, C. Allain, I. Ciofini, Revealing the origins of mechanically induced fluorescence changes in organic molecular crystals, Adv. Mater. 30, 1800817 (2018) [CrossRef] [Google Scholar]
- S.A. Jenekhe, J.A. Osaheni, Excimers and exciplexes of conjugated polymers, Science 265, 765–768 (1994) [CrossRef] [Google Scholar]
- F. Song, B. Liu, B.Z. Tang, Celebration of the 20th anniversary of aggregation-induced emission with research highlights from royal society of chemistry journals, J. Mater. Chem. C 8, 7972–7974 (2020) [CrossRef] [Google Scholar]
- J. Luo, Z. Xie, J.W.Y. Lam, L. Cheng, B.Z. Tang, H. Chen, C. Qiu, H.S. Kwok, X. Zhan, Y. Liu, D. Zhu, Aggregation-induced emission of 1-methyl-1,2,3,4,5-pentaphenylsilole, Chem. Commun. 18, 1740–1741 (2001) [CrossRef] [Google Scholar]
- Z.-F. Chang, L.-M. Jing, C. Wei, Y.-P. Dong, Y.-C. Ye, Y.S. Zhao, J.-L. Wang, Hexaphenylbenzene-based, π-conjugated snowflake-shaped luminophores: tunable aggregation-induced emission effect and piezofluo-rochromism, Chem. – Eur. J. 21, 8504–8510 (2015) [CrossRef] [Google Scholar]
- B. Prusti, M. Chakravarty, Disparity in piezofluo-rochromism for twisted mono-carbazole-based AIEgens resulting from interchanging electron-rich substituents: effect of coplanarity on twisted π-conjugates., Mater. Adv. 2, 1752–1759 (2021) [CrossRef] [Google Scholar]
- B. Xu, Z. Chi, J. Zhang, X. Zhang, H. Li, X. Li, S. Liu, Y. Zhang, J. Xu, Piezofluoro-chromic and aggregation-induced-emission compounds containing triphenylethylene and tetraphenylethylene moieties, Chem. – Asian J. 6, 1470–1478 (2011) [CrossRef] [Google Scholar]
- Y. Cao, W. Xi, L. Wang, H. Wang, L. Kong, H. Zhou, J. Wu, Y. Tian, Reversible piezofluorochromic nature and mechanism of aggregation-induced emission-active compounds based on simple modification, RSC Adv. 4, 24649–24652 (2014) [CrossRef] [Google Scholar]
- Z.-Q. Yao, J. Xu, B. Zou, Z. Hu, K. Wang, Y.-J. Yuan, Y.-P. Chen, R. Feng, J.-B. Xiong, J. Hao, X.-H. Bu, A dual-stimuli-responsive coordination network featuring reversible wide-range luminescence-tuning behavior, Angew. Chem. Int. Ed. 58, 5614–5618 (2019) [CrossRef] [Google Scholar]
- J. Sturalan, M.K. Etherington, A.N. Bismillah, H.F. Hig-ginbotham, W. Trewby, J.A. Aguilar, E.H.C. Bromley, A.-J. Avestro, A.P. Monkman, P.R. McGonigal, Excited-state aromatic interactions in the aggregation-induced emission of molecular rotors, J. Am. Chem. Soc. 139, 17882–17889 (2017) [CrossRef] [Google Scholar]
- P. Das, A. Kumar, A. Chowdhury, P.S. Mukherjee, Aggregation-induced emission and white luminescence from a combination of π- conjugated donor-acceptor organic Luminogens, ACS Omega 3, 13757–13771 (2018) [CrossRef] [Google Scholar]
- D.W. Cho, D.W. Cho, Excimer and exciple emissions of 1,8-naphthalimides caused by aggregation in extremely polar or nonpolar solvents, New J. Chem. 38, 2233–36 (2014) [CrossRef] [Google Scholar]
- J.G. Baragi, M.I. Aralaguppi, T.M. Aminabhavi, M.Y. Kariduraganavar, A.S. Kittur, Density, viscosity, refractive index, and speed of sound for binary mixtures of anisole with 2-chloroethanol, 1,4-dioxane, tetrachloroethylene, tetrachloroethane, DMF, DMSO, and diethyl oxalate at (298.15, 303.15, and 308.15) K, J. Chem. Eng. Data 50, 910–916 (2005) [CrossRef] [Google Scholar]
- NIST. Chemical Substance Database, 2023. Retrieved July 8, 2023, from https://webbook.nist.gov/chemistry/fluid/ [Google Scholar]
- E. Ramachandran, R. Dhamodharan, Rational design of phenothiazine (PTz) and ethylenedioxythiophene (EDOT) based donor–acceptor compounds with a molecular aggregation breaker for solid state emission in red and NIR regions, J. Mater. Chem. C 3, 8642–8648 (2015) [CrossRef] [Google Scholar]
- S.S.M. Fernandes, M. Belsley, A.I. Pereira, D. Ivanou, A. Mendes, L.L.G. Justino, H.D. Burrows, M.M.M. Raposo, Push–pull N,N-diphenylhydrazones bearing bithiophene or thienothiophene spacers as nonlinear optical second harmonic generators and as photosensitizers for nanocrystalline TiO2 dye-sensitized solar cells, ACS Omega 3, 12893–12904 (2018) [CrossRef] [Google Scholar]
- Conor Parks et al., Solubility curves and nucleation rates from molecular dynamics for polymorph prediction – moving beyond lattice energy minimization, Phys. Chem. Chem. Phys. 19, 5285–5295 (2017) [CrossRef] [Google Scholar]
Cite this article as: Lise Estournet, Mathieu Loriot, Inès Mezghani, Audrey Pollien, Nina Villette. Fluorescence emission modification of triphenylamine derivatives by aggregate formation in solution or by mechanical stress in solid state, Emergent Scientist 8, 1 (2024)
All Tables
Distribution of hydrodynamic diameters measured with DLS for 2 and 3 aggregates in DMF/H2O mixtures
Wavelengths and FWHM (Full Width at Half Maximum) of maximum emission bands for compounds 1–3 in the solid state (crystalline form, amorphous form, and after grinding).
All Figures
|
Scheme 1 Chemical structures of compounds 1–3. |
| In the text | |
|
Scheme 2 Synthesis pathways of the derivatives of triphenylamine 1. |
| In the text | |
|
Fig. 1 Study of 2 in DMF/H2O mixtures. a) Normalized emission spectra (λexc = 355 nm) with different water fractions (0% − 99%). Concentration of 2: C2,0 = 22.9 µmol.L−1. b) Distribution of hydrodynamic diameters of the formed aggregates of 2 for different water fractions (75% – 99%), measured with DLS. Concentration of 2: C2,0 = 22.9 µmol.L−1. |
| In the text | |
|
Fig. 2 Study of 3 in DMF/H2O mixtures. a) Normalized emission spectra (λexc= 435 nm) with different water fractions (0% – 95%). Concentration of 3: C3,0 = 19.0 µmol.L−1. b) Distribution of hydrodynamic diameters of the formed aggregates of 3 with different water fractions (75% – 95%), measured with DLS. Concentration of 3: C3,0 = 19.0 µmol.L−1. |
| In the text | |
|
Fig. 3 AIEE and AIE phenomena for the triphenylamine derivatives 2 and 3 as a function of the water volume fraction in the DMF/H2O mixture, under UV light (365 nm). |
| In the text | |
|
Fig. 4 Crystalline and amorphous forms of 2 and 3 under natural light and under UV light (365 nm). |
| In the text | |
|
Appendix 1 Emission (Em) and excitation (Exc) spectra of 2 at C2,0 = 22.9 µmol.L−1 for different water fractions (0% – 99%) in DMF. Excitation and emission wavelengths (in nm) are specified in brackets. |
| In the text | |
|
Appendix 2 Emission (Em) and excitation (Exc) spectra of 3 at C3,0=19.0 µmol.L−1 for water fractions in DMF (0% – 95%). Excitation and emission wavelengths (in nm) are specified in brackets. |
| In the text | |
|
Appendix 3 Hazard classes, category codes and suppliers of the used chemicals. |
| In the text | |
|
Appendix 4 NMR spectrum of the commercial 4-diphenylamino-benzaldehyde 2 in CDCI3. |
| In the text | |
|
Appendix 5 NMR spectrum of the synthetised 4-diphenylamino-benzaldehyde 2 in CDCl3. |
| In the text | |
|
Appendix 6 IR spectrum of the synthetised 4-diphenylamino-benzaldehyde 2. |
| In the text | |
|
Appendix 7 IR spectrum of the commercial 4-diphenylamino-benzaldehyde 2. |
| In the text | |
|
Appendix 8 IR spectrum of the synthetised 2- (4- (diphenylamino) benzylidene) malononitrile 3. |
| In the text | |
|
Appendix 9 Molecular orbitals of triphenylamine 1 and its derivatives 2 and 3, calculated respectively in gas phase, with water and DMF implicit solvation with the TDDFT method, using the CAM-B3LYP functional and the basis set 6-31G(d,p) after an optimization of the geometry of the molecules in each environment at CAM-B3LYP/6-31G(d,p) level. |
| In the text | |
|
Appendix 10 Energy values, oscillator strength f, and electric dipole moment µ of the ground state obtained from TDDFT theoretical calculations for molecules 1, 2, and 3 in gas phase or considering the solvent implicitly. |
| In the text | |
|
Appendix 11 Molecular orbitals involved in the transitions to the first and second excited states in a mono-excitation approximation. |
| In the text | |
|
Appendix 12 Crystalline phase emission (Em) and excitation (Exc) spectra of 1. Solid phase emission spectrum of 1 after melting on a Kofler bench and rapid recrystallization (Em BK). |
| In the text | |
|
Appendix 13 Crystalline and amorphous (KB) phase emission and excitation spectra of 2. Com: commercial 2; BK: Kofler bench melted synthesized 2 which gave the amorphous phase after rapid solidification; grinded: grinded synthesized 2. Excitation and emission wavelengths are specified in brackets. |
| In the text | |
|
Appendix 14 Crystalline and amorphous (KB) phase emission and excitation spectrum of 3. KB: Kofler bench melted 3 which gave the amorphous phase after rapid solidification; grinded: grinded 3. Excitation and emission wavelengths are specified in brackets. |
| In the text | |
|
Appendix 15 Excitation (Exc) and emission (Em) spectra of 2 at C2,0/2 = 11.5 µmol.L−1 for different water fractions (1% – 90%) in DMF. Excitation and emission wavelengths (in nm) are specified in brackets. |
| In the text | |
Current usage metrics show cumulative count of Article Views (full-text article views including HTML views, PDF and ePub downloads, according to the available data) and Abstracts Views on Vision4Press platform.
Data correspond to usage on the plateform after 2015. The current usage metrics is available 48-96 hours after online publication and is updated daily on week days.
Initial download of the metrics may take a while.