Fig. 5
Download original image
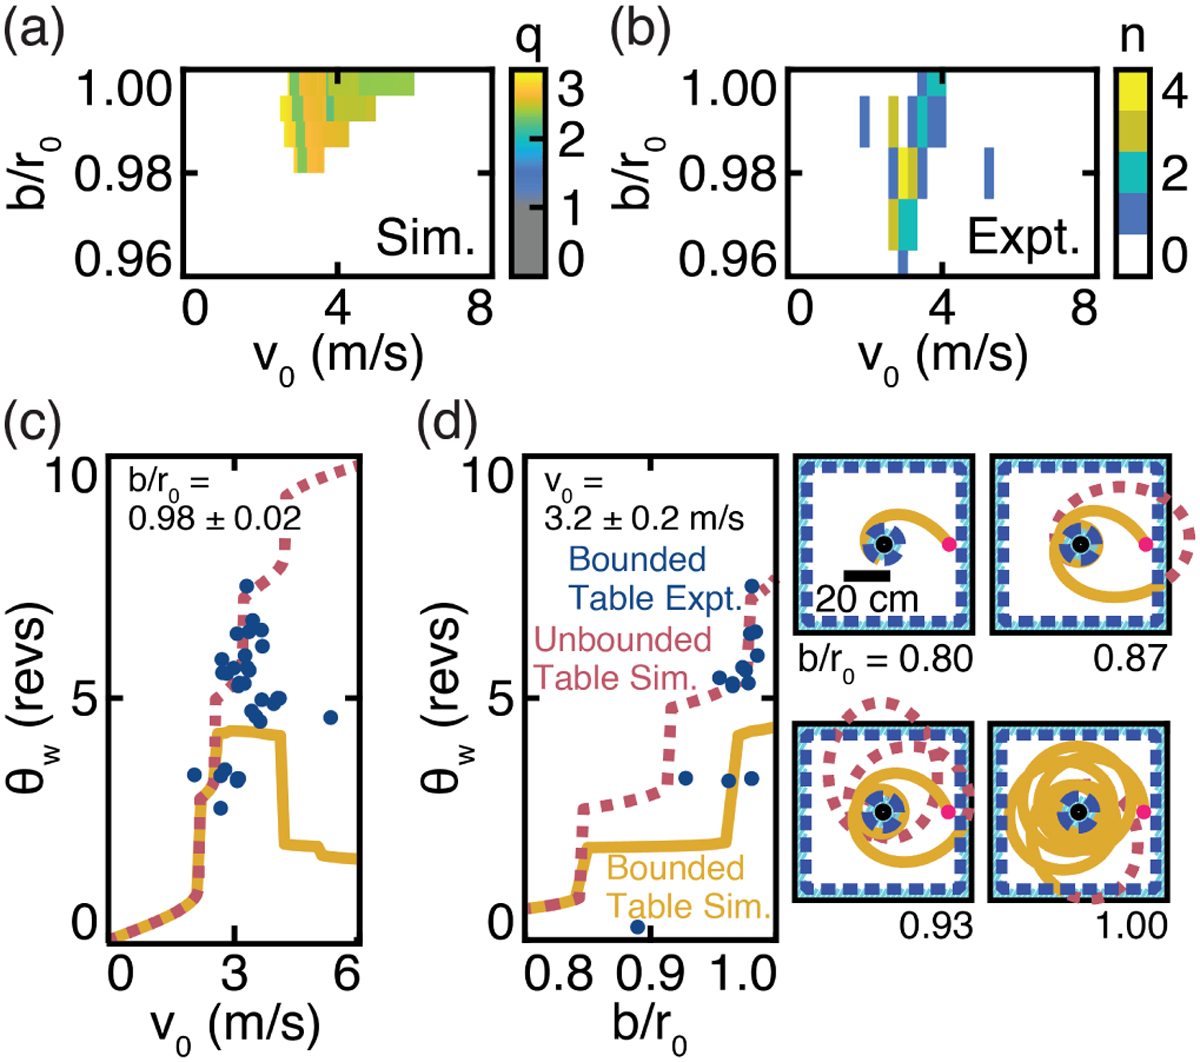
Zoom-whirl sensitivity. (a) Parameter-space heatmap of q from simulation for chosen experimental values µ = 0.01, MA = 0.35 kg, r0 = 0.28 m, and MB = 5.3 kg. For these parameter choices, all long-lived trajectories qualify as zoomwhirl orbits. (b) Parameter-space histogram of experimental trials with target combinations informed by (a); n describes the number of trials per combination. (c, d) Sensitivity analysis of θw . Simulated trajectories on a finite table often terminate at the outer boundary; those on an infinite table must terminate at the central boundary. Larger dissipative effects observed in experiment quickly draw MA away from the outer boundary, creating orbits that exclusively terminate at the central boundary. (Outset) Archetypal simulated trajectories demonstrate the discontinuous nature of the sensitivity plots with qualitatively distinct orbits.
Current usage metrics show cumulative count of Article Views (full-text article views including HTML views, PDF and ePub downloads, according to the available data) and Abstracts Views on Vision4Press platform.
Data correspond to usage on the plateform after 2015. The current usage metrics is available 48-96 hours after online publication and is updated daily on week days.
Initial download of the metrics may take a while.