Open Access
Fig. 4
Download original image
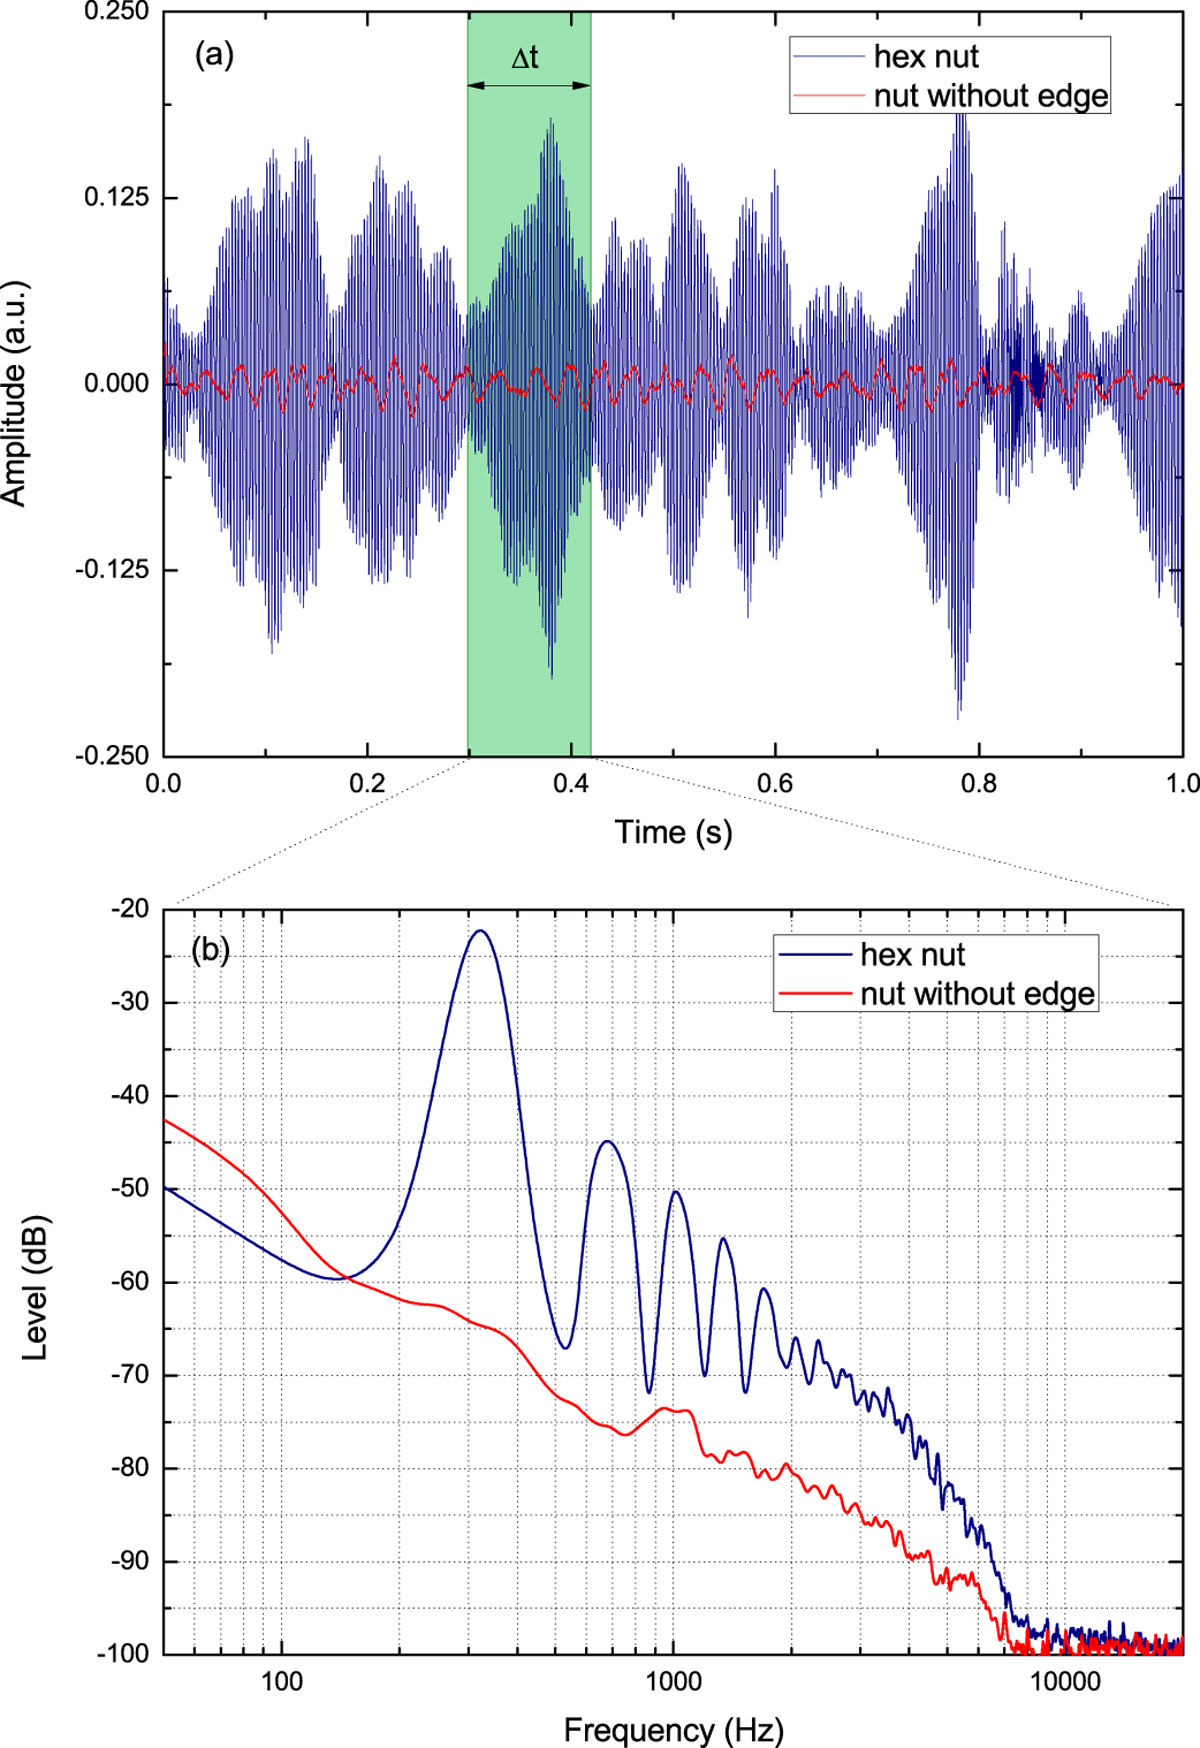
(a) Signal in time domain of two audios. (b) Spectrum of a segment of these two audio of the same duration (Δt). The blue line is for the nut A and a balloon of mean radius (9.7 ± 0.2) cm, with peak intensity of (345 ± 11) Hz, and red line is for the nut S and a balloon of mean radius (9.1 ± 0.2) cm.
Current usage metrics show cumulative count of Article Views (full-text article views including HTML views, PDF and ePub downloads, according to the available data) and Abstracts Views on Vision4Press platform.
Data correspond to usage on the plateform after 2015. The current usage metrics is available 48-96 hours after online publication and is updated daily on week days.
Initial download of the metrics may take a while.