Fig. 6
Download original image
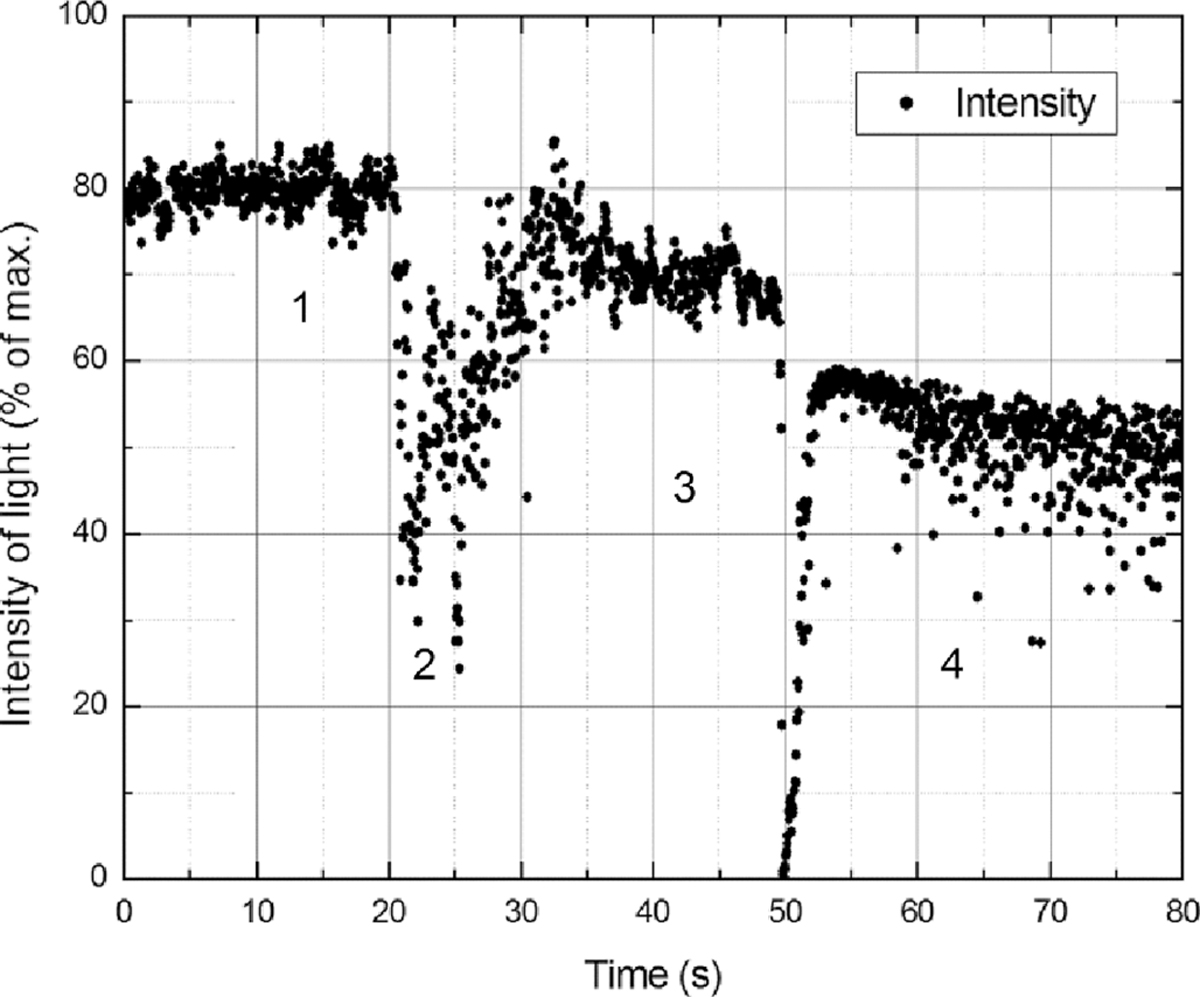
Typical experimental time trace. Region 1: the stirrer is off, corresponding to an average intensity of 80%. Region 2: At t = 20 s, honey is poured and some fluctuations are recorded, but most honey falls to the bottom. At this point, there is also an influence of diffusion process, noticed at t = 35 s. Region 3: the stirrer is turned on causing the sudden drop in light intensity. Region 4: the pattern of an exponential decay is noticed in a short period of time at t = 50 s, providing information about the fluid’s homogeneity through light intensity measurements. In t = 80 s, the stirrer is turned off and there is no longer data acquisition.
Current usage metrics show cumulative count of Article Views (full-text article views including HTML views, PDF and ePub downloads, according to the available data) and Abstracts Views on Vision4Press platform.
Data correspond to usage on the plateform after 2015. The current usage metrics is available 48-96 hours after online publication and is updated daily on week days.
Initial download of the metrics may take a while.