Fig. 14
Download original image
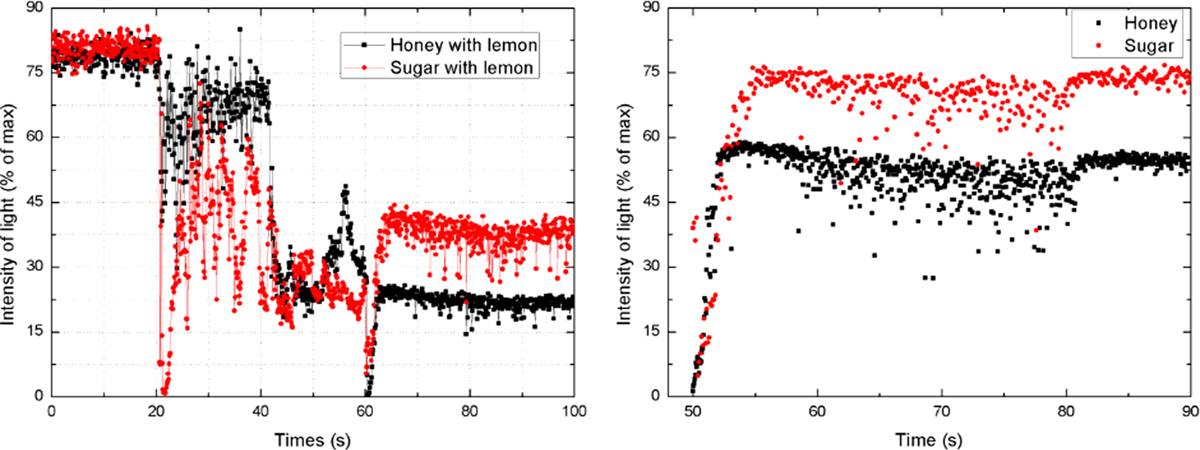
Left: Fits of stability curves for different honey concentrations. Comparison between the addition of lemon in two cases: tea with 5.0 g of sugar and tea with 5.0 mL of honey. The temperature was maintained constant in T = 34.0 °C. Right: comparison between honey (measurement of 5.0 ± 0.5 mL) and sugar (measurement of 5.0 ± 0.1 g) when added to tea at (83.0 ± 0.5) °C.
Current usage metrics show cumulative count of Article Views (full-text article views including HTML views, PDF and ePub downloads, according to the available data) and Abstracts Views on Vision4Press platform.
Data correspond to usage on the plateform after 2015. The current usage metrics is available 48-96 hours after online publication and is updated daily on week days.
Initial download of the metrics may take a while.