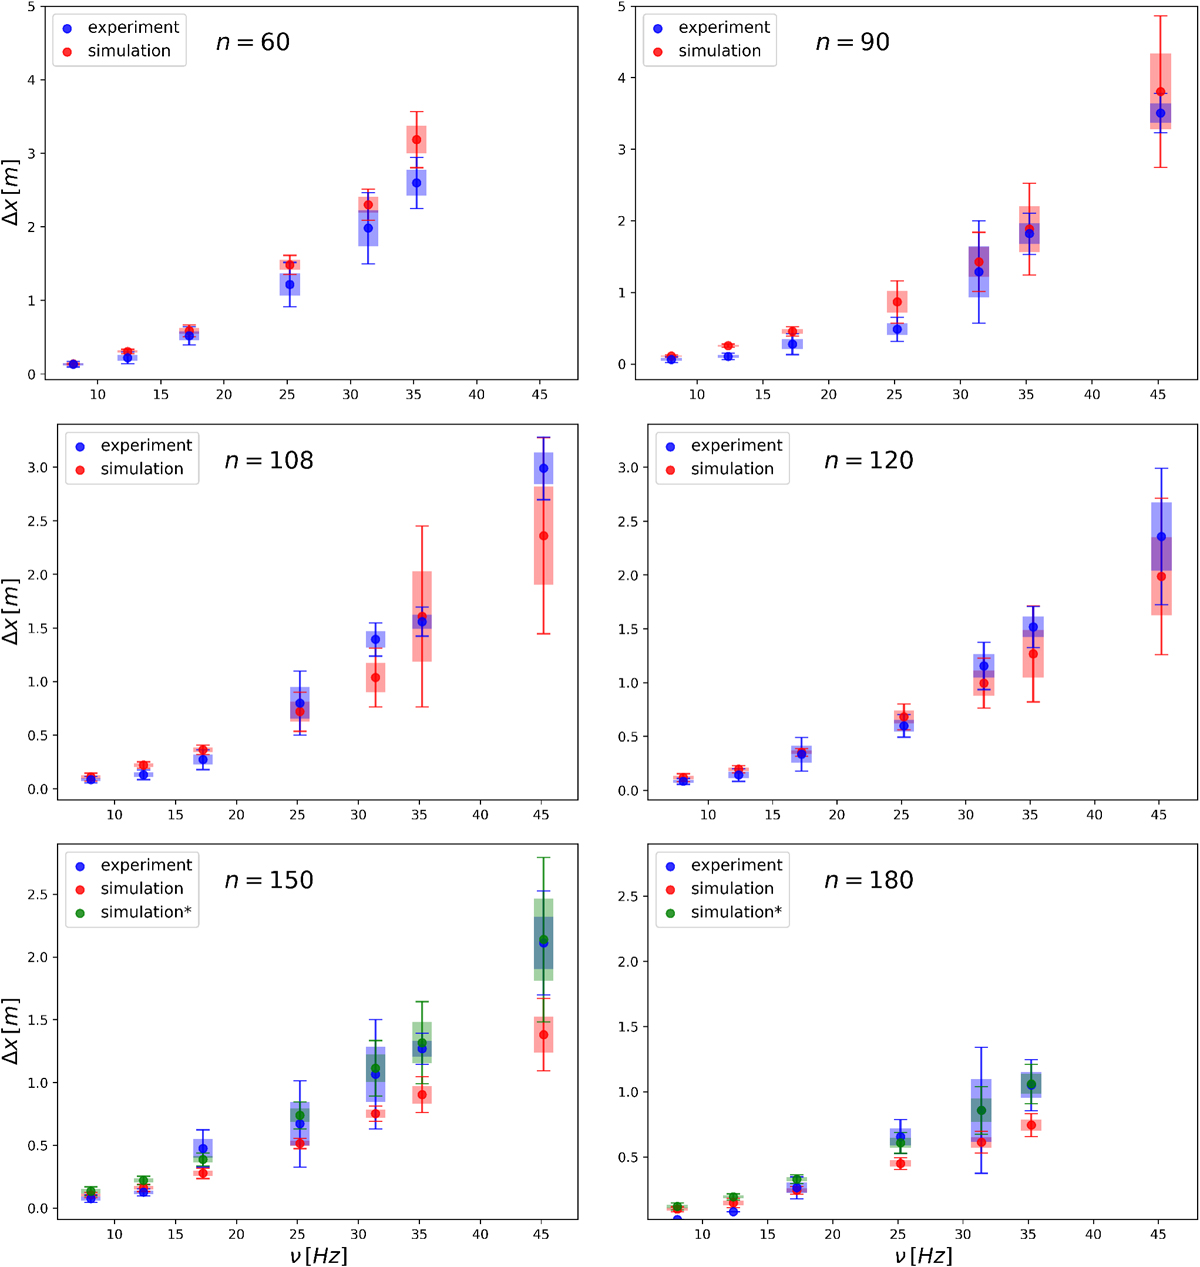
Fig. 6
Download original image
A comparison of simulated and experimentally determined distances the chain travelled Δx as functions of the drill frequency ν for varying number of chain links n. On all the subplots, ν measured in Hertz is marked on the x-axes and Δx measured in meters is on the y-axis. The experimental points drawn are averages of four measurements, whilst the simulated points are averages of 12 simulations. The vertical boxes signify the range of one standard deviation and the vertical bars signify the range of two standard deviations. Red points were simulated from rest, while green points were initialized as spinning in an elliptical shape.
Current usage metrics show cumulative count of Article Views (full-text article views including HTML views, PDF and ePub downloads, according to the available data) and Abstracts Views on Vision4Press platform.
Data correspond to usage on the plateform after 2015. The current usage metrics is available 48-96 hours after online publication and is updated daily on week days.
Initial download of the metrics may take a while.